Diagrams (Tutorial)
|
|
Diagrams (Tutorial) |
www.CAD6.com |
|
This chapter uses some commands that are only available in CAD6studio and/or CAD6industrie!
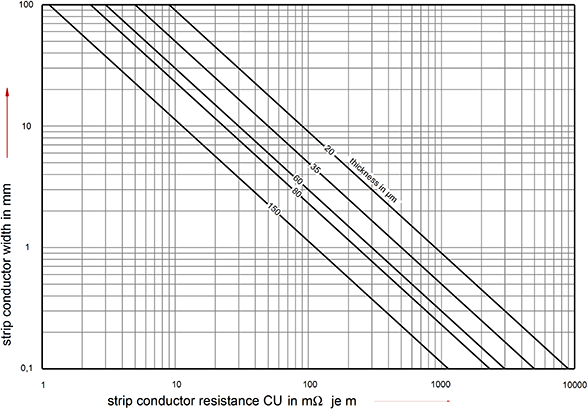
AimMalz++Kassner CAD6 makes it possible to draw complicated technical drawings for various technical purposes. In this example a double logarithmic resistance diagram showing Ohmic conductor resistance against conductor width
SettingsTutorial.mkd, with the page set to landscape orientation.
Set the boundaries of the diagram. Using the pen "0.25 mm\Solid Line Narrow" or a self-defined thin pen, draw the left and bottom boundaries of the diagram with Draw > Line > Horizontal and Draw > Line > Vertical Leave enough space to add further text. You can resize the diagram at a later stage, but getting it right now will save work later. So that the diagram looks tidy, use "Corner/Endpoint" snapping mode to make sure that the vertical lines do not extend below the intersections (Figure 1).
Figure 1
The diagram is divided into four decades in the X-direction and 3 decades in the Y-direction. To draw the grid lines use the command Modify > Move / Copy Objects > Multiple Copy, Line Division. Begin with the X-divisions. Identify the vertical line and (with "Intersection" snapping mode on) choose the intersection of both lines as the reference point. This is also the start point; the end point is the end of the horizontal line. Click on the Logarithmic radio button and enter 4 as the number of decades. Close the dialog by clicking on OK (Figure 2).
Figure 2
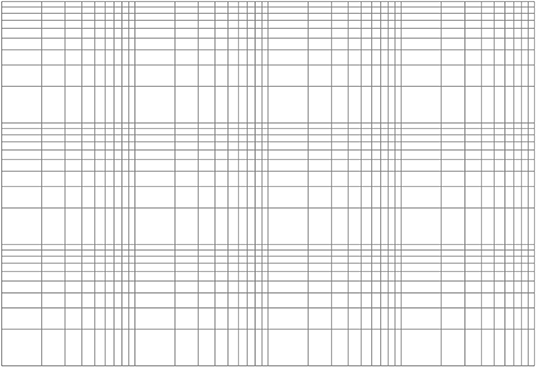
Proceed in a similar way to make the multiple copy of the vertical line. The start point is the same, but the end point is the top of the vertical line and there are three decades (Figure 3).
Figure 3
You have now created a piece of logarithmic graph paper as the grid for the diagram.
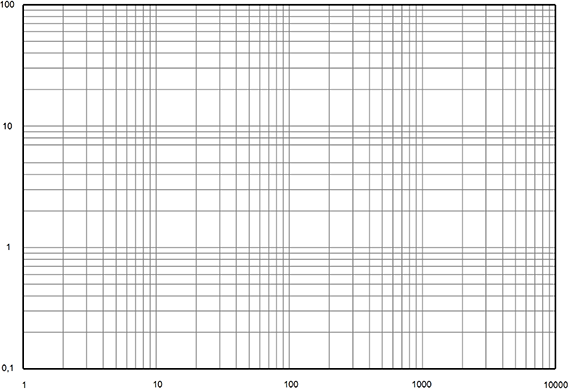
Next, label the axes at the appropriate points with appropriate values. In the example, 4 mm high text is used. The X axis labeling can also be placed rotated by 90°. To do this enter the rotation angle in the Annotate > Text > Standard. To align the labeling with a line, draw a vertical and a horizontal Construction Aid endless line parallel to the relevant axis. You can place the label text on these lines making use of "Edge" snapping mode (Figure 4)
Figure 4
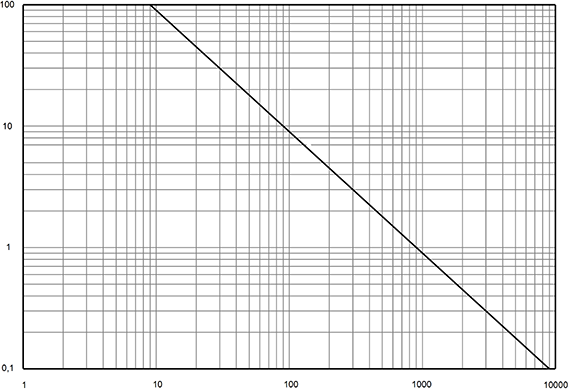
Now you can begin to draw the graph lines using the pen "0.5 mm\Solid Line Wide". This can be done with the help of bases and Bézier curves or Splines, or, as here, with a straight line through defined points. Begin with the line (20 µm) through the points (9000/0.1) and (30/30). These points are already present as intersections in the diagram. Turn "Intersection" snapping mode on and click on the relevant intersections. To extend the line to the edge of the grid, use Trim > Trim Object > Length / Radius to Object, identify the upper part of the last-drawn line and click on the uppermost horizontal line as the reference line (Figure 5).
Figure 5
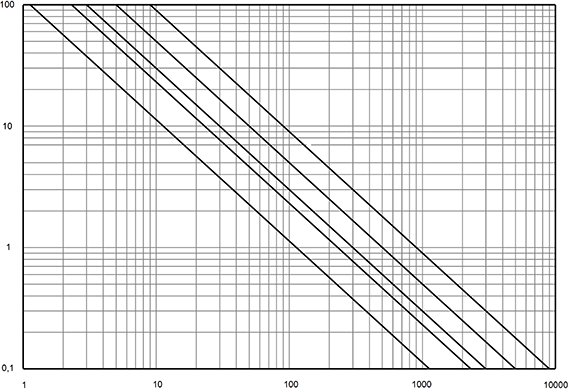
Because all the graphs in the example or parallel lines, the line has to be duplicated running through the new reference points. Activate the duplicate function by pressing F7 and use Modify > Move Objects > Perpendicular. to move the line. Identify the graph line and choose any vertical gridline as the reference line. The point chosen as the reference point is very important. A point should be chosen which brings the new graph line onto an intersection or a previously placed mark. This point now has to be moved to the new target position. For the first copy, choose the lower corner point and move it to (5000/0.1). Do the same for the other graph lines. You can take suitable reference points from the example diagram (Figure 6).
Figure 6
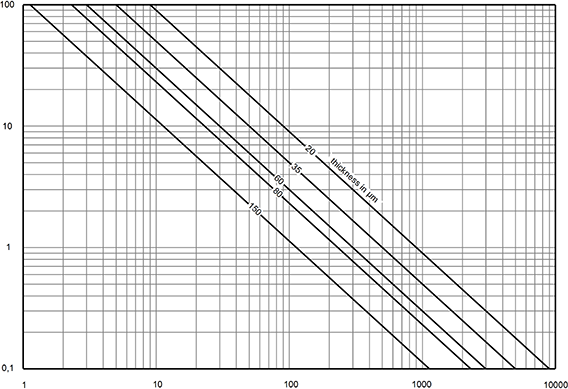
So that the lines can be labeled with text running at the correct angle, the line angle has to be measured. Use Annotate > Dimension > Angle, Line - Line to measure the angle between the graph line and the horizontal grid lines. The parameters are not important because after noting the angle, the dimension is immediately removed by using Edit > Undo (BACKSPACE).
Enter the angle, preceded by a minus sign (-) (the text is rotated clockwise, mathematically negative) into the dialog of Annotate > Text > Standard. In the example 3 mm high text is used. Place the text up against the graph line in the diagram. It is not necessary to go through the whole process for each new piece of text - it is enough to restart the command using SHIFT+ESC (N) and enter a new text (Figure 7).
Figure 7
The texts are directly above the lines and are difficult to read. To make them easier to read, place an erasing surface behind each piece of text to hide the grid lines. Use Draw > Polygon > Freeform / Surface to draw a surface covering a piece of text, set its filling mode to "Eraser" using Modify > Object Properties > Edit and then use Modify > Change Order > To Front to bring the text to the front (Figure 8).
Figure 8
Finally, label the axes. Enter the text using Annotate > Text > Standard The Omega symbol is from a different font and is added separately. The arrows are straight dimension lines. To align them correctly place a Construction Aid endless line (Construct > Construction Aid Endless Line > Horizontal) in the middle of the X-axis label. Using Annotate > Dimension Line > Straight with "Edge" snapping mode active, the dimension arrow can be aligned exactly horizontally. Proceed in a similar way for the vertical dimension arrow (Figure 9).
Figure 9
Alternative Forms of DiagramsLinear or logarithmic diagrams can easily be created in the same way. During the multiple copy process, a linear division is used for one or both axes.
Non-linear graph lines, of which only coordinate points are known, are approximated using Splines or Bézier curves. This is explained in the following example (the Trouser Leg).
|
CAD6studio Release 2024.2 - Copyright 2024 Malz++Kassner® GmbH